|
The real power of BioExplorer comes from the ability to connect
signal processing and display objects any way you want.
The following objects are available for use in the Signal Diagram:
AND
The output is the logical AND of two or more signals
Audio Player
Plays audio files (mp3, wma, wave, midi, etc.) Volume and
Play/Pause can be controlled by one or more
signals.
Averager
Calculates the average value of a signal over a specified time
period.
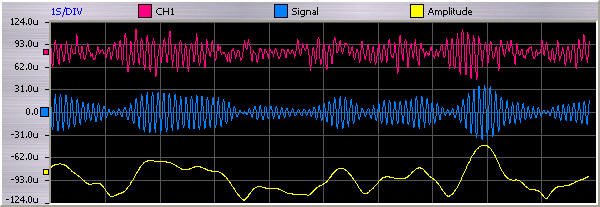
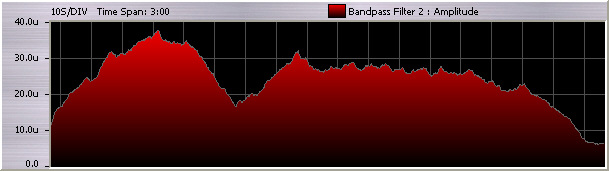
Bandpass Filter
Filters a signal, allowing frequency components that are between
the low band edge and the high band edge to pass through, and
attenuating components outside this range. Outputs the
filtered signal as well as the amplitude of that signal.
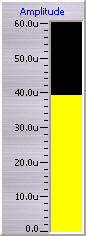
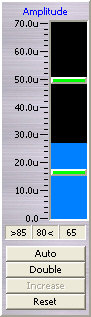
Bar Graph
Graphically indicates the current value of a signal.
Button NEW!
Allows you to manually set the state of a signal.

CD Player
Plays audio CDs. Volume and Play/Pause can be controlled by one or more
signals
Coherence
Calculates the coherence between two signals.
Continuous MIDI
Plays a continuous MIDI note. Volume, Pitch, and
Play/Pause can be controlled by one or more signals.
Correlation
Calculates the correlation between two signals.
Counter
Counts properties of a signal (rising edges, falling
edges, time high or time low).
Difference
Outputs the difference between the current sample and the
previous sample.
Dominant Frequency
Calculates the dominant frequency (the frequency component with
the largest amplitude) of a signal.
DVD Player
Plays DVDs. Volume and Play/Pause can be controlled by one or more
signals
Expression Evaluator
Uses a user-defined expression to calculate the output based on
one or more signals, e.g. '( In2 - In1 ) / (In1 + In2 )'.
Max NEW!
Outputs the maximum value of a signal.
Mean Frequency
Calculates the mean frequency in a given bandwidth.
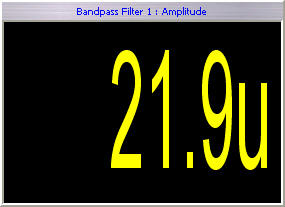
Meter
Indicates the current value of a signal.
MIDI
Plays musical notes at a periodic rate. The volume, note, and timing
can be controlled by one or more signals.
Min NEW!
Outputs the minimum value of a signal.
NOT
The output is the logical NOT of a signal.
OR
The output is the logical OR of two or more signals.
Oscilloscope
Displays one or more signals over time.
Power Ratio
Calculates the ratio of the power in two frequency bands, or the
percent of the total power contained in one frequency band of a
signal.
Pulse Detector
Given an EKG signal, determines the current pulse
rate.
Source
This object represents a channel on a device (e.g. BrainMaster
channel 1, etc). Source objects are used to get data from a
device into the Signal Diagram.
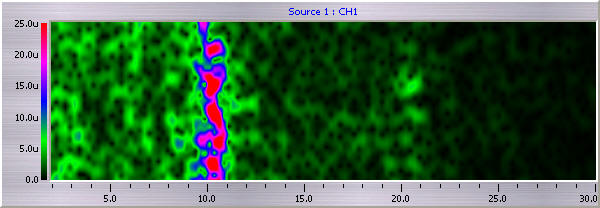
Spectrum Analyzer
Displays the spectrum of a signal. Currently supports four
different modes: spectrogram (shown below), bins, compressed
spectral array, and 3D.
Standard Deviation
Calculates the Standard Deviation and Mean of a signal over a
specified time period.
Threshold
This object compares a signal to a threshold. You
can set the threshold manually or have the object adjust it
automatically based on characteristics of the signal.
Tone Generator
Generates an audio tone. Frequency, Volume, and Play/Pause
can be controlled by one or more signals.
Trend NEW!
Displays the mean value of one or more signals over a
user specified time period (e.g. 10 minutes). New data is added to
the right side and the display scrolls to the left, so the last 'x'
amount of time is always visible.
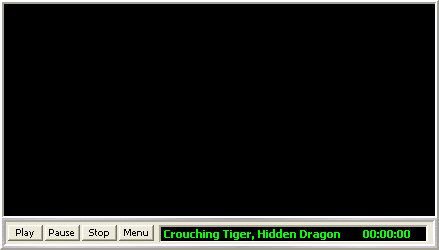
Video Player
Plays video files (mpeg, wmv, avi, etc.) Volume and
Play/Pause can be controlled by one or more
signals

|